The first part of this article is posted on Team Public Health at Substack.
1 Introduction
Human decision intelligence (HDI)1 is applying ethics, science, and technology to support team and individual decisions to solve problems, achieve objectives, and improve and innovate in the face of time constraints, uncertainty, and trade-offs. Think of human decision intelligence in the same way you might think about human emotional intelligence. A foundational component of HDI is decision quality — the six requirements of good decision making. At a minimum, a decision quality checklist (DQ) (Table 1) improves the quality of decisions at any stage of problem solving. A good decision is only as strong as its weakest link.
Table 1: Key questions to answer for decision quality (DQ)
No.
Requirement
Key question to ask
1
Frame
Are we clear on the problem we are solving?
2
Values
Have we identified what we truly want?
3
Alternatives
Do we have a good set of alternatives?
4
Information
Have we gathered the relevant information?
5
Reasoning
How will we evaluate alternatives to find the one that gets us the most of what what we truly want?
Hiring an employee, selecting a contractor, or ranking a set of proposals uses a common team approach. Team members usually rate the alternatives using pre-determined criteria that have been weigthed based on importance. Alternatives with high scores on the most important criteria (ie, higher weight) will be ranked at or near the top.
To summarize:
develop criteria
weight criteria
rate alternatives using the weighted criteria.
rank the alternatives
Ideally, the criteria should be weighted without any knowledge of the alternatives. This is to prevent evaluators from biasing the criteria weights in favor of their favorite alternative.
In this blog posting I show how to weight criteria using a simple ranking method. In a future blog post, I will show how to apply weighted criteria to rank and select alternatives. This first step, weighting criteria, is very powerful and practical. We will use a trivial example to nail down the concepts.
Now, suppose we wish to buy a car and our choices are a Honda Civic, and Subaru Impreza, or Toyota Corolla. We have data on the following attributes: safety (S), mileage (M), reliability (R), color (C), price (P), and resale value (V). Table 2 summarizes the DQ requirements for buying our car.
Table 2: Decision quality requirements for buying a car
No.
Requirement
Key question to ask
Answer
1
Frame
Are we clear on the problem we are solving?
Need personal transportion.
2
Values
Have we identified what we truly want?
Car within my budget.
3
Alternatives
Do we have a good set of alternatives?
Civic, Corolla, or Impreza
4
Information
Have we gathered the relevant information?
Color, mileage, price, reliability, safety, resale value
5
Reasoning
How will we evaluate alternatives to find the one that gets us the most of what what we truly want?
Ranking algorithm using weight calculations
6
Commitment
Are we committed to follow through on our choice.
Yes, my spouse approves.
3 Calculating criteria weights — the easy way
Group deliberative decision-making is cognitively exhausting. So, anything you can do to make the process easier will keep team members engaged. Do not let “perfection become the enemy of the good.” The easiest way to generate criteria weights from a team of evaluators is to use a rank ordinal method [1].
Give evaluators small pieces of paper with one criterion printed on on each. If we have five criteria, they get five small pieces of paper. Have them rank them from top to bottom. Once they have ranked them, tape their ranking onto an 8.5in x 11in paper and hand to the facilitator. This ranking is entered into the computer for analysis (see below).
3.1 Ratio ordinal method in Julia
I will demonstrate this method using the Julia language. This method can also be implemented using R, Python, or Microsoft Excel.
For rating the cars we have six criteria (attributes) for which we need to calculate weights:
Color (C)
Mileage (M)
Price (P)
Reliability (R)
Safety (S)
Value, resale (V)
We have five evaluators that will rank the criteria based on their knowledge, experience, expertise, and wisdom. It is much better for them to rank the criteria independently and without thinking about specific cars, otherwise they may game (bias) the weighting.
Here are the steps:
Select a ranking method to calculate weights for a specific number of criteria, in this case we have six criteria. We will write and use a Julia function that implements the SR method from [1].
Have each evaluator independently rank the criteria.
Use Julia to calculate the final criteria weights. We will use the split-apply-combine workflow that I introduced in a previous blog post and book review [2].
3.1.1 Step 1: The SR method for generating criteria weights
Here is the formula2 where \(N\) is the number of criteria, and \(w_i^{SR}\) is the weight for the \(i^{th}\) criterion [1].
For this calculation I use the Julia Language. Julia is as simple to program as Python but with the speed of C++. These calculations can also be completed in R.
usingDataFramesusingStatsBasefunctioncalculate_rank_weights(n::Int64) num =zeros(n)for i in1:n num[i] = (1/i) + ( (n +1- i) / n )end wi = num /sum(num)return wiendwi =calculate_rank_weights(6)
Next, we organize the evaluator criteria rankings and the SR method criteria weights into a data frame with three columns:
evaluators (optional)
evaluator_rankings (required)
weights (required)
ne =5; # number of evaluatorsnc =6; # number for criteriaevaluators =repeat(["eval".*string.(1:ne)...], inner=repeat([nc]))evaluator_rankings =vcat( eval1, eval2, eval3, eval4, eval5 )weights =repeat( wi, ne )df =DataFrame(hcat(evaluators, evaluator_rankings, weights), ["evaluator", "criteria", "weight"] )
30×3 DataFrame
5 rows omitted
Row
evaluator
criteria
weight
Any
Any
Any
1
eval1
Mileage
0.336134
2
eval1
Color
0.22409
3
eval1
Price
0.168067
4
eval1
Safety
0.12605
5
eval1
Reliability
0.0896359
6
eval1
Value
0.0560224
7
eval2
Mileage
0.336134
8
eval2
Color
0.22409
9
eval2
Safety
0.168067
10
eval2
Reliability
0.12605
11
eval2
Value
0.0896359
12
eval2
Price
0.0560224
13
eval3
Color
0.336134
⋮
⋮
⋮
⋮
19
eval4
Mileage
0.336134
20
eval4
Value
0.22409
21
eval4
Color
0.168067
22
eval4
Safety
0.12605
23
eval4
Reliability
0.0896359
24
eval4
Price
0.0560224
25
eval5
Safety
0.336134
26
eval5
Price
0.22409
27
eval5
Color
0.168067
28
eval5
Reliability
0.12605
29
eval5
Mileage
0.0896359
30
eval5
Value
0.0560224
3.1.3 Step 3: Calculate mean criteria weights
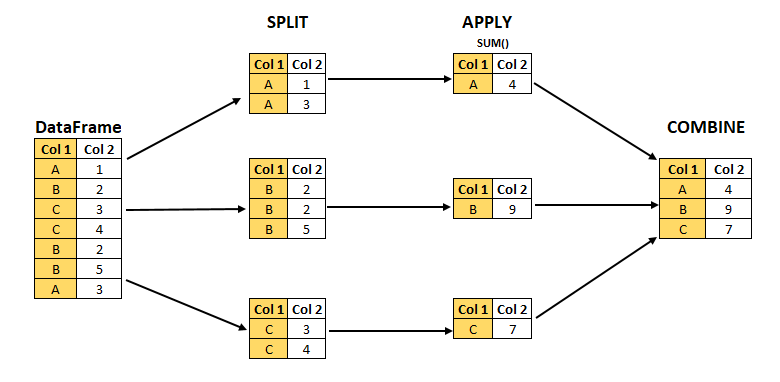
Calculate mean criteria weights using split-apply-combine workflow (Figure 1). In other words, stratifying by one or more criteria, what is the mean weight for each strata (attribute)?
Figure 1: The split-apply-combine is a common workflow in data science.
## splitgdf =groupby(df, :criteria)
GroupedDataFrame with 6 groups based on key: criteria
These are the final criteria weights and, as expected, they sum to 1.
round(sum(crit_weights.weight_mean))
1.0
4 Appendix
4.1 Function to automate calculating mean weights
We created the calculate_rank_weights function to calculate the weights for \(n\) criteria using the SR method. Then we used Julia to calculate the mean weights for five evaluators.
Now we create a final function to automate calculating the mean weights. This function will handle an arbitrary number of vectors with rankings, or a matrix created from those vectors beforehand. Notice that this new function will call our previous calculate_rank_weights function.
The results are saved in r and the semi-colon (;) suppresses the output. We use typeof function to evaluate the type of r2.
typeof(r2)
@NamedTuple{weights::DataFrame, data::DataFrame}
We see that r2 is a NamedTuple and it contains two data frames named weights and data. We can index each separately.
r2.weights
6×2 DataFrame
Row
criteria
weight_mean
Any
Float64
1
Mileage
0.244818
2
Color
0.22409
3
Safety
0.162465
4
Price
0.134454
5
Value
0.129972
6
Reliability
0.104202
r2.data
30×3 DataFrame
5 rows omitted
Row
evaluator
criteria
weight
Any
Any
Any
1
eval1
Mileage
0.336134
2
eval1
Color
0.22409
3
eval1
Price
0.168067
4
eval1
Safety
0.12605
5
eval1
Reliability
0.0896359
6
eval1
Value
0.0560224
7
eval2
Mileage
0.336134
8
eval2
Color
0.22409
9
eval2
Safety
0.168067
10
eval2
Reliability
0.12605
11
eval2
Value
0.0896359
12
eval2
Price
0.0560224
13
eval3
Color
0.336134
⋮
⋮
⋮
⋮
19
eval4
Mileage
0.336134
20
eval4
Value
0.22409
21
eval4
Color
0.168067
22
eval4
Safety
0.12605
23
eval4
Reliability
0.0896359
24
eval4
Price
0.0560224
25
eval5
Safety
0.336134
26
eval5
Price
0.22409
27
eval5
Color
0.168067
28
eval5
Reliability
0.12605
29
eval5
Mileage
0.0896359
30
eval5
Value
0.0560224
The calculate_mean_weights function worked for both vectors or a matrix. This was possible because of the splat operator (...) as in the two lines below.
functioncalculate_mean_weights(x...) x =hcat(x...)
References
1.
Danielson M, Ekenberg L. Trade-offs for ordinal ranking methods in multi-criteria decisions. In: Bajwa D, Koeszegi ST, Vetschera R, editors. Group decision and negotiation Theory, empirical evidence, and application [Internet]. Cham: Springer International Publishing; 2017. p. 16–27. Available from: https://doi.org/10.1007/978-3-319-52624-9_2
2.
Kaminski B. Julia for data analysis. New York, NY: Manning Publications; 2023.
Footnotes
I focus on human decision intelligence (HDI), in contrast to “decision intelligence” (DI). “Decision intelligence is an engineering discipline that augments data science with theory from social science, decision theory, and managerial science. Its application provides a framework for best practices in organizational decision-making and processes for applying machine learning at scale. The basic idea is that decisions are based on our understanding of how actions lead to outcomes. Decision intelligence is a discipline for analyzing this chain of cause and effect, and decision modeling is a visual language for representing these chains.”↩︎
The SR method was selected because it was the best performing.↩︎